
“We’re smashing our goals! Our blog pulled in 10,000 visitors this month!”
I hear that happy shout at least twice a week from owners who call me up, proud about their “awesome” numbers. Then I throw out the question that freezes the air:
“How many of those 10,000 visitors signed up for your product or booked a demo?”
The reply is nearly always the same: “Uh… not sure.”
Here’s the hard lesson I have learned after studying hundreds of business blogs: ten thousand visitors a month means nothing if none turn into trials, demos, or sales.
Essentially, you need to re-think your content marketing metrics.
The Vanity Metrics Trap – Drains Your ROI
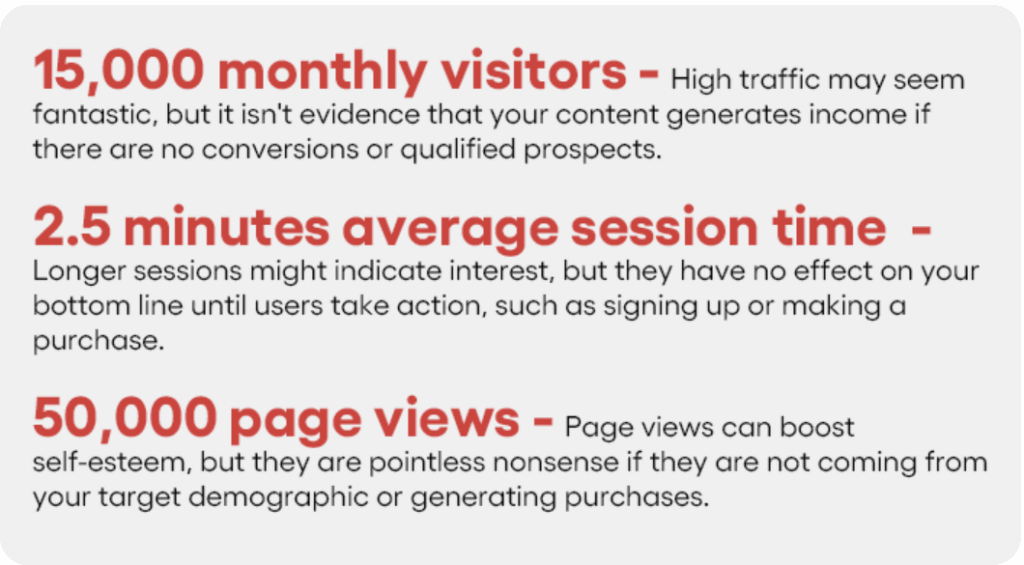
Last month, I teamed up with a SaaS firm that was over the moon about its blog. They opened Google Analytics and boasted about:
“This content marketing thing is definitely working!” they cheered.
Then, I peeled back the numbers. Of those 15,000 visitors, only twenty-three people had clicked the sign-up button. This landed the conversion rate at 0.15 percent. For perspective, most sites sit around 2.5 to 3 percent, while direct traffic usually clocks in at 3.3 percent.
They were shelling out $8,000 a month on articles, videos, and ads, yet the return barely covered a fast-food lunch.
The Blog Bounce Rate Reality Check
Here is an alarming reality: many blogs now bounce between 60 percent and 90 percent, and yes, some push straight to 90 percent. The sweet spot most websites aim for is 26 percent to 40 percent, yet the majority of blogs sit miles short of that goal.
I witnessed this myself while digging into a client’s so-called best post. It showcased:
• 5,000 visitors each month
Although steady traffic is fantastic, it is merely a sentimental figure with no return on investment if there is no lead generation or customer action.
• A shiny #3 ranking for the target keyword
Although having a high ranking is commendable, a term isn’t really beneficial if it doesn’t draw in customers or support company objectives.
• A flood of social media shares
Although viral content is thrilling, it won’t actually advance a business if it doesn’t generate targeted traffic or conversions.
But after adding Hotjar to monitor eyes and clicks, the outcome was brutal: a 92 percent bounce rate. Readers arrived, skimmed for half a minute, then bolted without completing a single meaningful action.
The writing was solid and informative, yet it acted like a barrier. There were no obvious next steps, no urgent calls to action, and no route that might lead to a sale.
I hope you will never want to dodge blunders like these. There is a smarter, people-centered way to gauge whether your content pays off. This is exactly what the best digital marketing agency focuses on, measuring ROI-driven results, not vanity numbers.
What to Track Instead: The Metrics That Really Matter
1. Organic-to-Signup Scroll Depth
These days, instead of just counting visitors, I watch organic-to-signup scroll depth with Hotjar. It shows me:
• How far visitors slide down the page before they sign up
• Which paragraph or graphic seals the deal
• Where we lose interested readers for good
For the client with a cringe-worthy 92 percent bounce rate, this insight was a turning point. We saw that every person who eventually converted had scrolled past the 60 percent mark.

2. Content-to-Customer Attribution
Now I trace every new buyer back to the very first piece they read. HubSpot or even Google Analytics 4 can tell you:
• Which articles really turn casual readers into bankable customers.
• The full path from first blog visit to credit-card click.
• Lifetime value attached to specific posts, not to vague channels.
One client learned the hard way that her 5,000-word ultimate guide produced 500 monthly visitors but zero sales, while a quick how-to with only 50 visitors spawned three customers worth $15,000 each.
3. Engagement Quality Score
I built a custom measure that blends four signals:
• Visitors spend at least 2 minutes on the page
• They scroll past the halfway mark
• Each session opens at least two pages
• More than 10% return within 30 days
Together, these factors produce an Engagement Quality Score that far surpasses simple hit counts.
4. Revenue-Per-Visitor (RPV) by Content Type
Instead of chasing cost-per-click, I watch revenue-per-visitor by post type:
• Tutorial guides: $2.50 per visitor
• Full case studies: $8.75 per visitor
• In-depth industry reports: $12.20 each
• Quick listicles: $0.30 per visitor
For ecommerce, pairing content with expert ecommerce SEO services has shown a remarkable boost in conversions and visibility across product-driven posts.
The numbers reshaped our editorial calendar; we stopped chasing viral listicles and focused on lucrative, detailed case studies.
5. Content Funnel Velocity
I also found how quickly readers move through the funnel:
B2B ecommerce usually converts at 3.9%, while professional services average 3.4%, so I measure my pace against sector benchmarks, not generic blog averages.
The Mid-Content CTA Revolution
A simple tweak is to place a call to action in the middle of the post, which raised conversions for 8 out of 10 clients.
Instead of tracking a call to action onto the end of a post, a spot where 60 to 90 percent of readers have already slipped away, I place value-driven prompts at key scroll points:
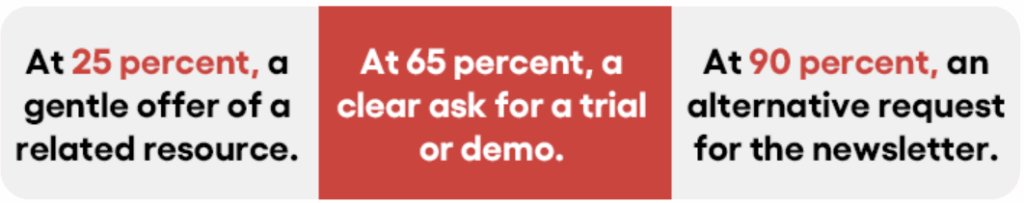
Each prompt speaks to the topic the reader is already engaged with.
Your Action Plan: The Metrics Audit
This is the exact routine I follow in week one with every new client:
1. Install a behavior tool (Hotjar, Microsoft Clarity, or something similar).
2. Set up conversion tracking for both big and small wins.
3. Build live dashboards that show content ROI, not just visits.
4. Review your top ten posts for hidden conversion openings.
5. A/B test CTA spots at the depths noted above.
The Attribution Model That Changed Everything
One of my biggest learnings came when I added full attribution for a B2B software client that had relied on Google’s last-click default. That model credited only the last touch before sale, so it painted an incomplete picture.
The takeaway

Here is what happened when we shifted to a linear attribution model, which assigns equal weight to every touchpoint a customer encounters on the road to purchase:
Under the last-click model:
• Paid ads claimed 80 percent of the credit
Ad networks frequently give themselves too much credit; if this isn’t done correctly, the true impact of other important touchpoints may be obscured.
• Blog articles took just 5 percent
Low attribution does not imply low value; rather, it indicates inadequate tracking of top-funnel impact. Blogs frequently play an early, unseen influence.
• Emails received the remaining 15 percent
Email is given considerable credit, but its nurturing potential throughout the buyer experience is significantly understated in the absence of multi-touch attribution.
After moving to linear attribution:
• Blog content contributed to 67 percent of final conversions
• The typical customer journey averaged eight distinct touchpoints
• Blog posts appeared as the very first touch in 43 percent of new-path cases
Seeing these facts changed the companies’ approach to content overnight and forced a serious re-thinking of the budget. Leadership understood the blog was not merely generating top-of-funnel buzz; it was a reliable revenue driver.
The Content Marketing ROI Revolution
The surprising twist, however, is that 68 percent of brands already enjoying stronger ROI attribute at least part of that gain to artificial intelligence.
I have seen this shift with my own eyes. One manufacturing client spent $15,000 each month on content that generated decent traffic but failed to link any sales.
Once we added robust tracking and attribution modeling, the story unfolded:
• Their technical white papers carried a customer-acquisition cost twelve
times higher than that of case studies.
• Video assets produced four times as many qualified leads as written pieces.
• Interactive calculators converted at 23 percent, compared to only 2
percent for standard blog posts.
Armed with these insights, the client reallocated budget toward higher-ROI formats and boosted content-driven revenue by 480 percent within six months.
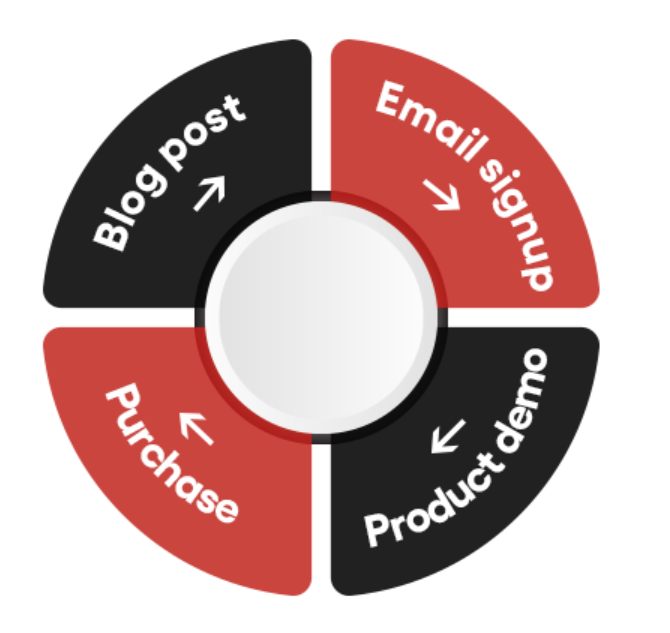
Customer-journey analytics builds a clear map of the entire client experience by linking every interaction across brand touchpoints. Below is the framework I follow.
Phase 1: Awareness Touchpoints
• Organic search blog visits
• Social media content engagement
• Podcast guest appearances or posts
• Mentions in industry publications
Phase 2: Consideration Touchpoints
• Email newsletter clicks
• Downloads of guides, white papers, or templates
• Webinar attendance
• Product-comparison page views
Phase 3: Decision Touchpoints
• Demo-request page visits
• Pricing page reads
• Customer-testimonial page views
• Conversations with sales staff
Phase 4: Retention Touchpoints
• Product tutorials
• Success case studies
• Community forum participation
• Upgrade or upsell content
Each stage calls for its own content form and set of success metrics. Treating all stages with the same traffic-and-bounce-rate yardstick is as impractical as using one hammer for every building task.
The Advanced Analytics Stack That Actually Works
When layered with expert ecommerce SEO services, these tools not only track traffic but also ensure ecommerce brands generate measurable sales growth. After testing dozens of analytics setups, here’s the tech stack that consistently delivers actionable insights:
Layer 1: Behavioral Analytics
• Hotjar or Microsoft Clarity for heat maps and session recordings
• Google Analytics 4, with Enhanced e-commerce and key custom events
• Search Console for content performance and query data
Layer 2: Attribution Tracking
• HubSpot, Salesforce, or Pipedrive for CRM-based touch attribution
• Hyper-detailed UTM parameter scheme for campaign tracking
• Call-tracking software for phone-based conversions
Layer 3: Advanced Insights
• Customer-journey mapping tools for full multi-touch attribution
• Revenue-attribution platforms for content ROI conversion
• A/B testing tools for needle-moving conversion optimization
The key is joining these layers so you see performance from first touch to lifetime value.
The Content Audit That Saves Six Figures
I conduct what I call a Revenue Content Audit for every client, and the method has flagged hidden revenue worth hundreds of thousands. A process like this, when handled by the best digital marketing agency, like us, ensures every dollar spent on content ties back to growth.
Step 1: Content Performance Scoring
Each piece scores on:
• Traffic quality
• Conversion rate per source
• Customer acquisition cost
• Lifetime value of acquired customers
• Time to conversion
Step 2: Content Gap Analysis
Next, I map holes in the funnel:
• What questions do customers ask sales teams?
• Which objections surface most often?
• What assets do competitors own that you lack?
• Where are visitors exiting the path?
Step 3: Content Optimization Roadmap
Then I rank fixes by impact:
• High traffic, low conversion: optimize
• Low traffic, high conversion: promote
• High traffic, high conversion: scale
• Low traffic, low conversion: retire
One client had forty-seven posts that drove zero conversions. We cut thirty-one, fine-tuned twelve, and wrote four new, goal-focused pieces. Creation time dropped sixty percent, yet revenue traced to content soared three hundred forty percent.
The Psychology Behind Content Conversions
After reviewing thousands of high-performing articles and videos, I learned a handful of psychological cues that shift ordinary web traffic into actual revenue:
Trigger 1: Specificity Over Generality
• Generic: How to Improve Your Marketing
• Specific: How We Increased B2B Lead Quality by 340% Using Intent Data
Trigger 2: Outcome Certainty
• Vague: Marketing tips that work
• Certain: The 3-step email sequence that converts 23% of trial users to
paid customers
Trigger 3: Social Proof Integration
• Without proof: This strategy is effective
• With proof: This strategy helped 47 SaaS companies reduce churn by an
average of 31%
Trigger 4: Implementation Clarity
• Theoretical: You should track metrics
• Practical: Install this code snippet to track scroll depth conversions
In short, these triggers turn good content into assets that drive revenue, not just clicks.
The Content-to-Customer Playbook
Below is the step-by-step routine I follow when I need to turn sluggish blog posts into steady customer-finders:
Week 1: Analytics Implementation
• Set tracking for every key conversion event.
• Add a multi-touch attribution model.
• Build custom dashboards that show content ROI.
Week 2: Content Audit
• Review the top twenty posts by traffic.
• Note gaps and spot missed conversion chances.
• Link each piece to a stage of the customer journey.
Week 3: Optimization Testing
• A/B-test where CTAs sit and what they say.
• Try fresh lead magnets and new offers.
• Speed up load times and polish the mobile view.
Week 4: Performance Analysis
• Check how conversion rates shift.
• Work out the new ROI for each piece.
• Pinpoint posts ready to scale.
This repeatable cycle has delivered 200-400 percent gains in ROI for content work across dozens of sectors.
The Million-Dollar Question: What’s Your Content Really Worth?
Use this quick math to find out:
• Start with your monthly spends on content.
• Multiply that figure by twelve for the yearly cost.
• Divide by the number of customers the content brought in.
• Compare the result to your average customer lifetime value.
If that cost-per-customer sits above 25 percent of lifetime value, traffic numbers alone won’t save you -you are losing money on the effort.
75% of content marketers say adding images or video improves return on investment. Yet true ROI only appears when teams measure the right indicators and focus on conversions rather than empty statistics.
The Bottom Line: Stop Celebrating Traffic and Start Counting Customers
Traffic becomes a vanity number if it fails to produce business growth. 54% of marketers track ROI internally; the remaining work in the dark, cheering meaningless totals while rivals capture customers.
I have watched companies with 1,000 monthly blog readers earn more profit than competitors attracting 50,000. The secret lay in monitoring meaningful data and fine-tuning for conversions instead of mere clicks.
Visitor counts count for little if they do not cover payroll. Shift attention to the journey that turns a reader into a paying client.
We are here to get you far ahead of your rivals
While other brands are still high-fiving each other over a few thousand page views and one lucky viral post, our team at Nico Digital will already be way ahead on the board. So, how do we get things done?

Where most agencies play checkers with a scattershot strategy, we play chess, using revenue-focused analytics to direct every move toward the bottom line.
How we measure success differently at Nico Digital
• We count revenue, not just downloads, as the final measure of content success
• Our full-funnel attribution tracks every touchpoint, not just the last click that gets the credit
• We optimize for lifetime value, not one-off conversion rates
As a result, clients report average content ROI growth of 300 to 500 percent within just ninety days
The content marketing field is changing at a massive speed, and brands that cling to outdated metrics will get stranded. AI now powers every phase of creation and optimization, yet many agencies still lean on stone-age stats to judge forward-thinking work. At Nico Digital, the best digital marketing agency in Kolkata, we are not simply ahead of the curve; we are busy designing the next one.
So, if you are geared up to shift your content from a line-item expense to a genuine revenue stream, we are here to help. Reach out to us, and together we will convert your blog traffic into actual deposits.